
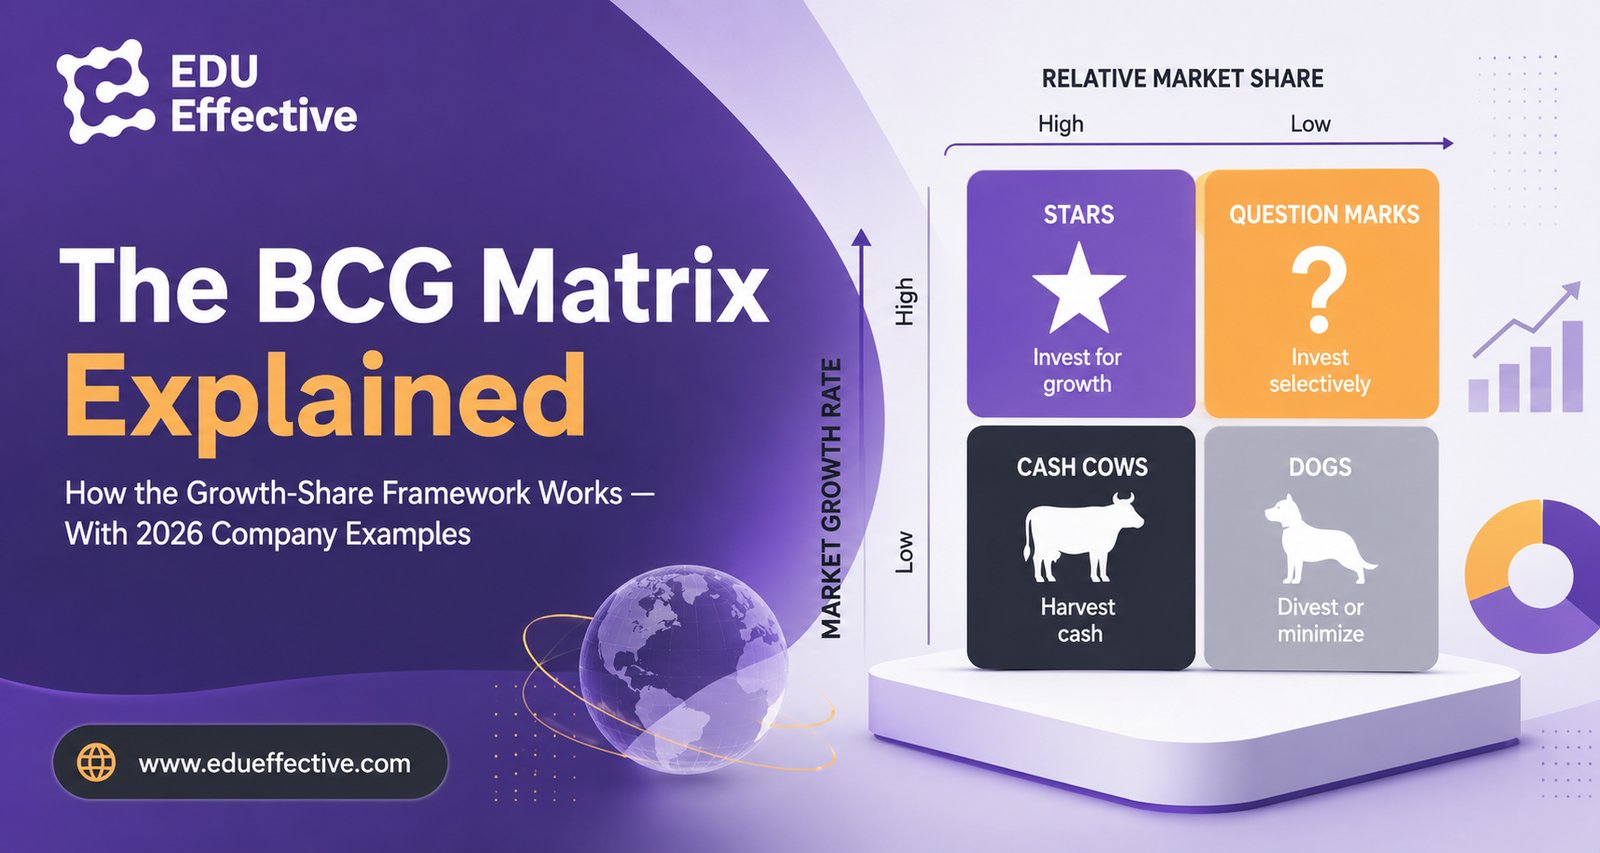

Most strategic frameworks age badly. The BCG Matrix does not. Created by Bruce Henderson of the Boston Consulting Group in 1970, it remains one of the most widely used tools in corporate strategy — not because it's simple (though it is), but because the underlying question it forces a company to answer has never stopped being relevant: across everything we make and sell, where should we actually be putting our resources?
In 2026, with AI investments reshaping corporate portfolios, companies retiring product lines faster than ever, and the smartphone market maturing to a fraction of its former growth rate, the BCG framework is producing some notably updated answers. The most instructive one involves Apple — and the iPhone.
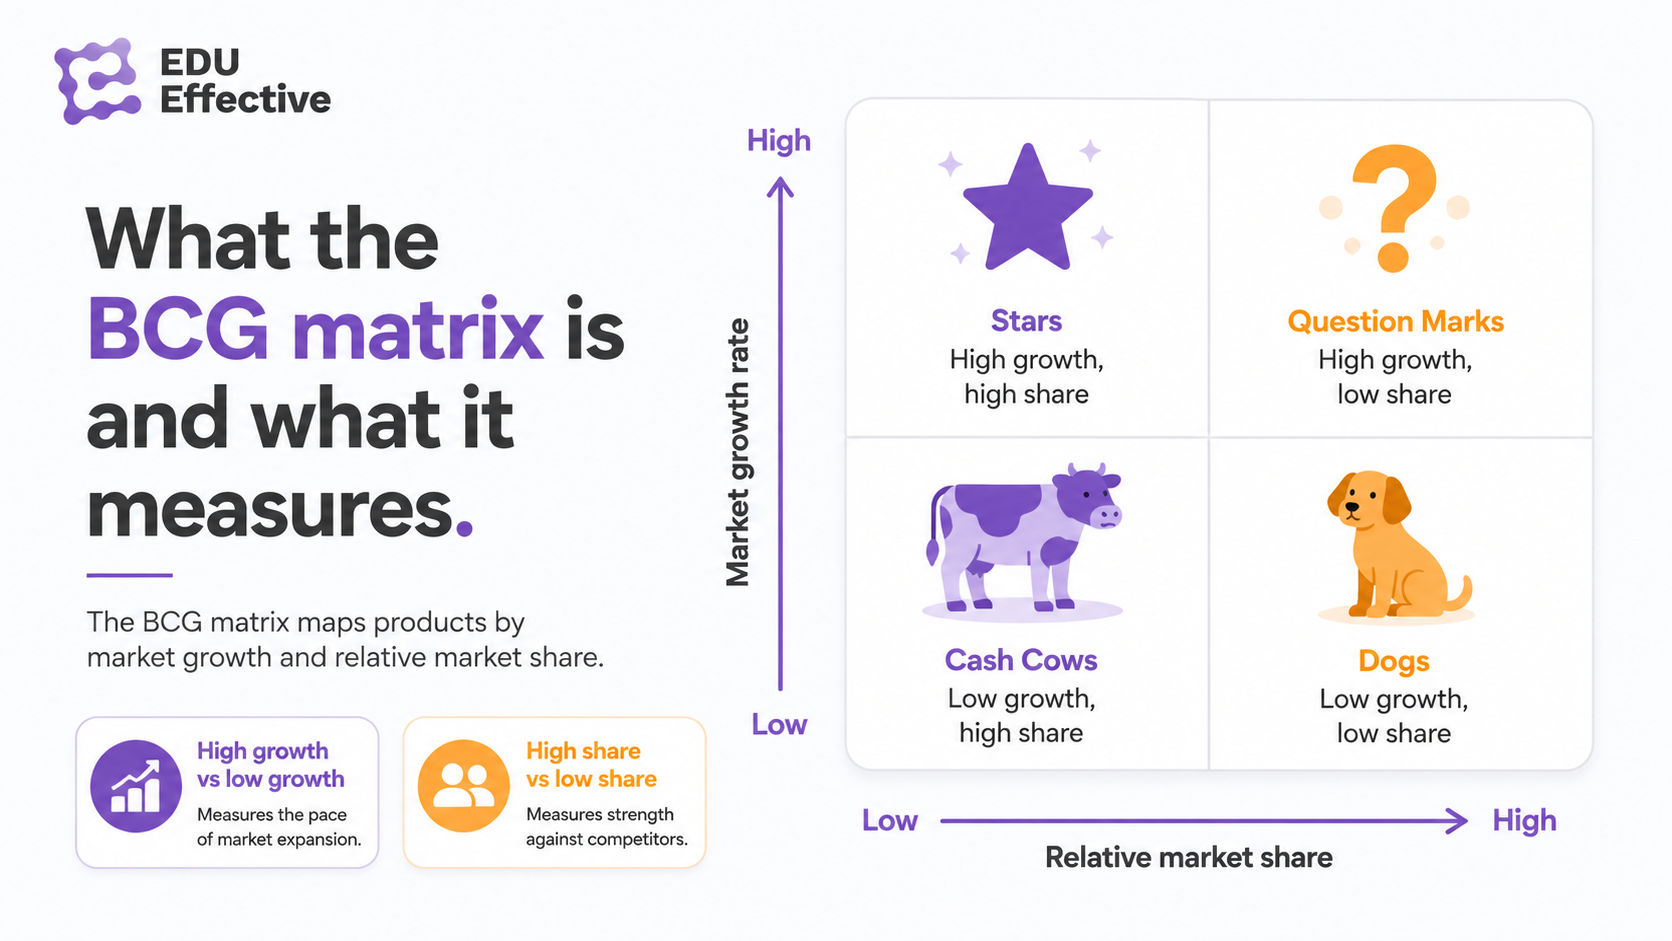
What the BCG matrix is and what it measures
The BCG growth-share matrix plots a company's products, services, or strategic business units (SBUs) across two dimensions: the growth rate of the market they compete in, and the company's relative market share within that market.
Relative market share is not your absolute market share. It's your market share divided by your largest competitor's market share. A score above 1.0 means you lead the market. Below 1.0 means someone else does. This distinction matters because high relative share indicates competitive advantage — the scale, cost efficiencies, and pricing power that come from leading a market.
Market growth rate is measured as the year-over-year percentage change in the total market size. High growth markets attract new entrants and require sustained investment to maintain position. Low growth markets are more stable but offer less room for expansion.
Plotting these two dimensions against each other produces a 2x2 matrix with four quadrants. Each quadrant has a name, a strategic logic, and a recommended default action — though the framework is most useful as a starting point for rigorous thinking, not a substitute for it.
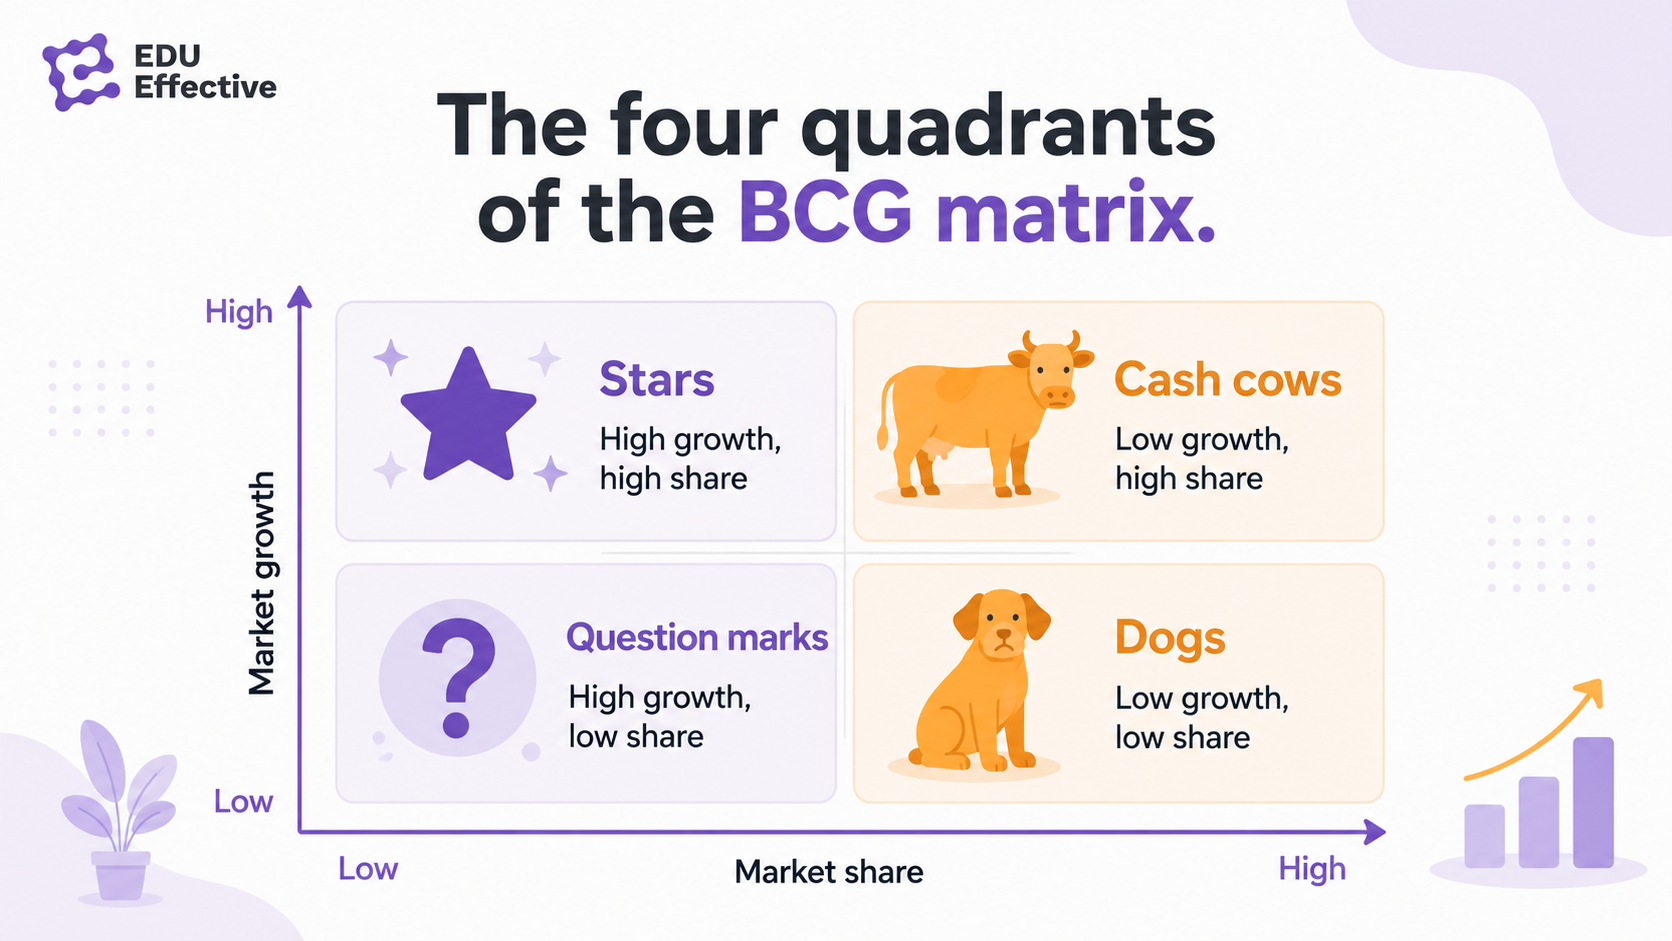
The four quadrants of the BCG growth-share matrix
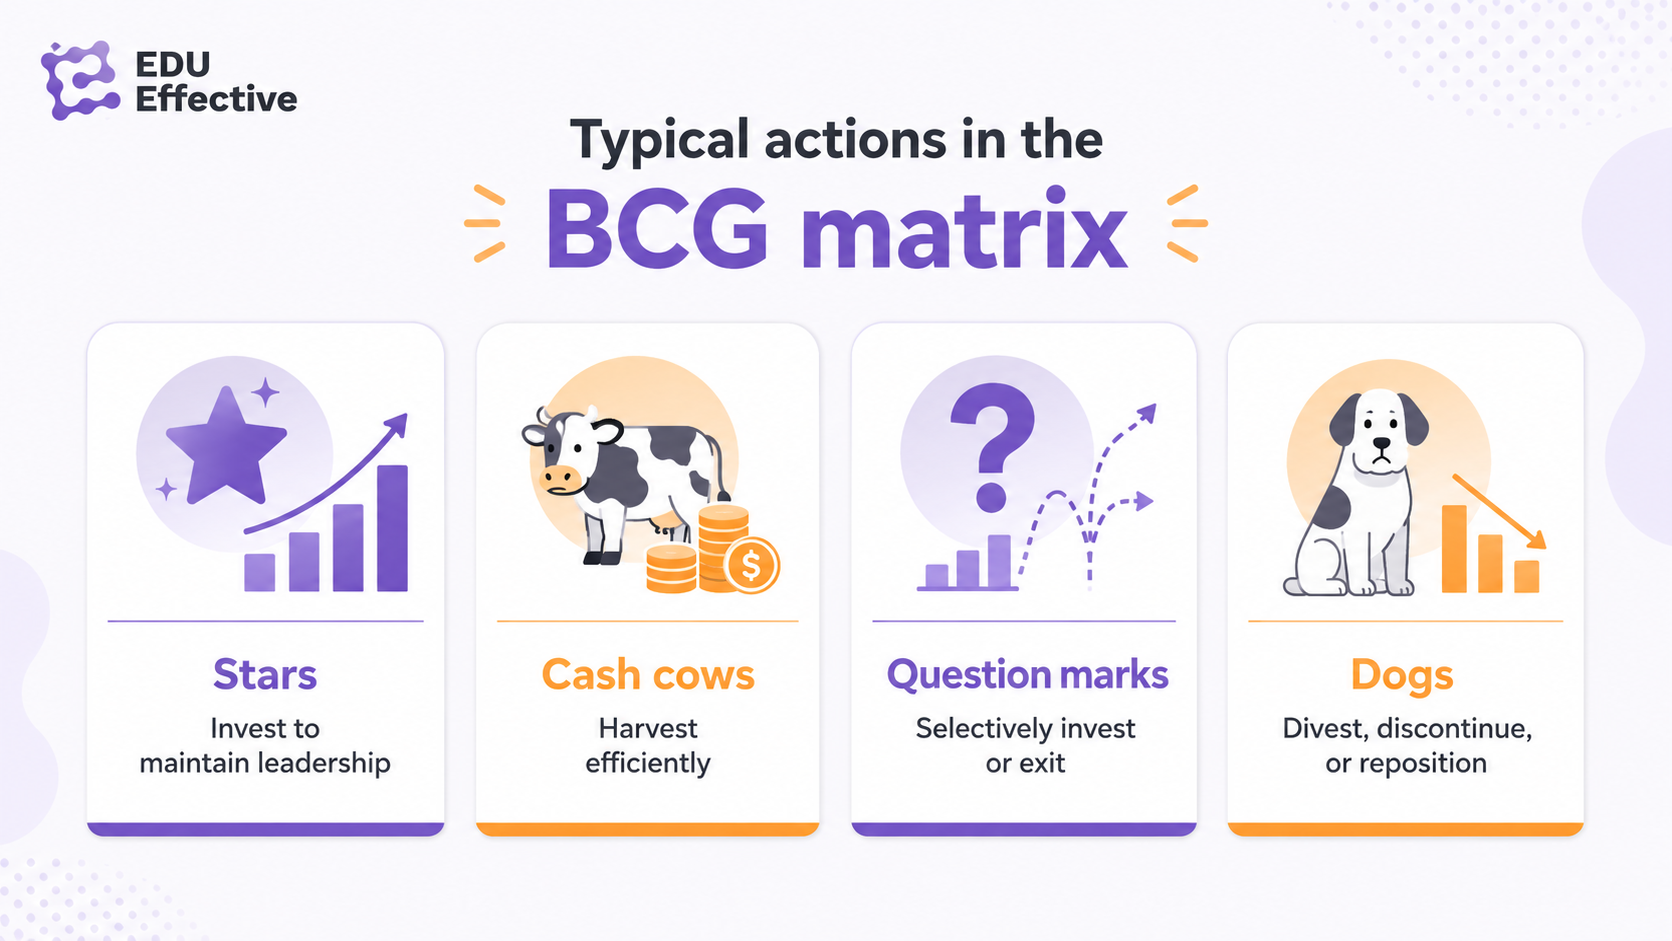
Stars: high market growth, high relative market share. Stars are your leading products in fast-growing markets. They generate significant revenue, but because the market is growing quickly and competition is intense, they also require sustained investment in marketing, R&D, and distribution to maintain their position. A star that holds its ground as market growth eventually slows will graduate into a cash cow. The strategic imperative is to invest sufficiently to protect and extend the leading position — while recognising that this is not cheap.
Cash Cows: low market growth, high relative market share. Cash cows are the financial engine of a diversified portfolio. They dominate mature markets where the competitive battles have largely been settled, the customer base is established, and investment requirements are relatively modest. They generate more cash than they consume, and that surplus is what funds the rest of the portfolio — including investment in stars and selected question marks. The strategic imperative is to harvest efficiently, not to over-invest in growth that the market no longer offers.
Question Marks: high market growth, low relative market share. Question marks compete in fast-growing markets but hold a weak competitive position. They require heavy investment just to keep pace with market growth, let alone gain ground on better-positioned competitors. Some question marks will become the next generation of stars if backed with the right strategy and sufficient capital. Others will stall and decline into dogs. The strategic challenge is distinguishing between the two — and making that call before the window closes.
Dogs: low market growth, low relative market share. Dogs occupy weak positions in slow-growth markets. The conventional strategic recommendation is divestiture or discontinuation — they rarely generate enough surplus cash to justify ongoing investment, and they absorb management attention that could be directed elsewhere. That said, some dogs provide portfolio balance, serve niche customer segments, or generate ancillary value that a pure market-share analysis misses. The decision to exit should be deliberate rather than reflexive.
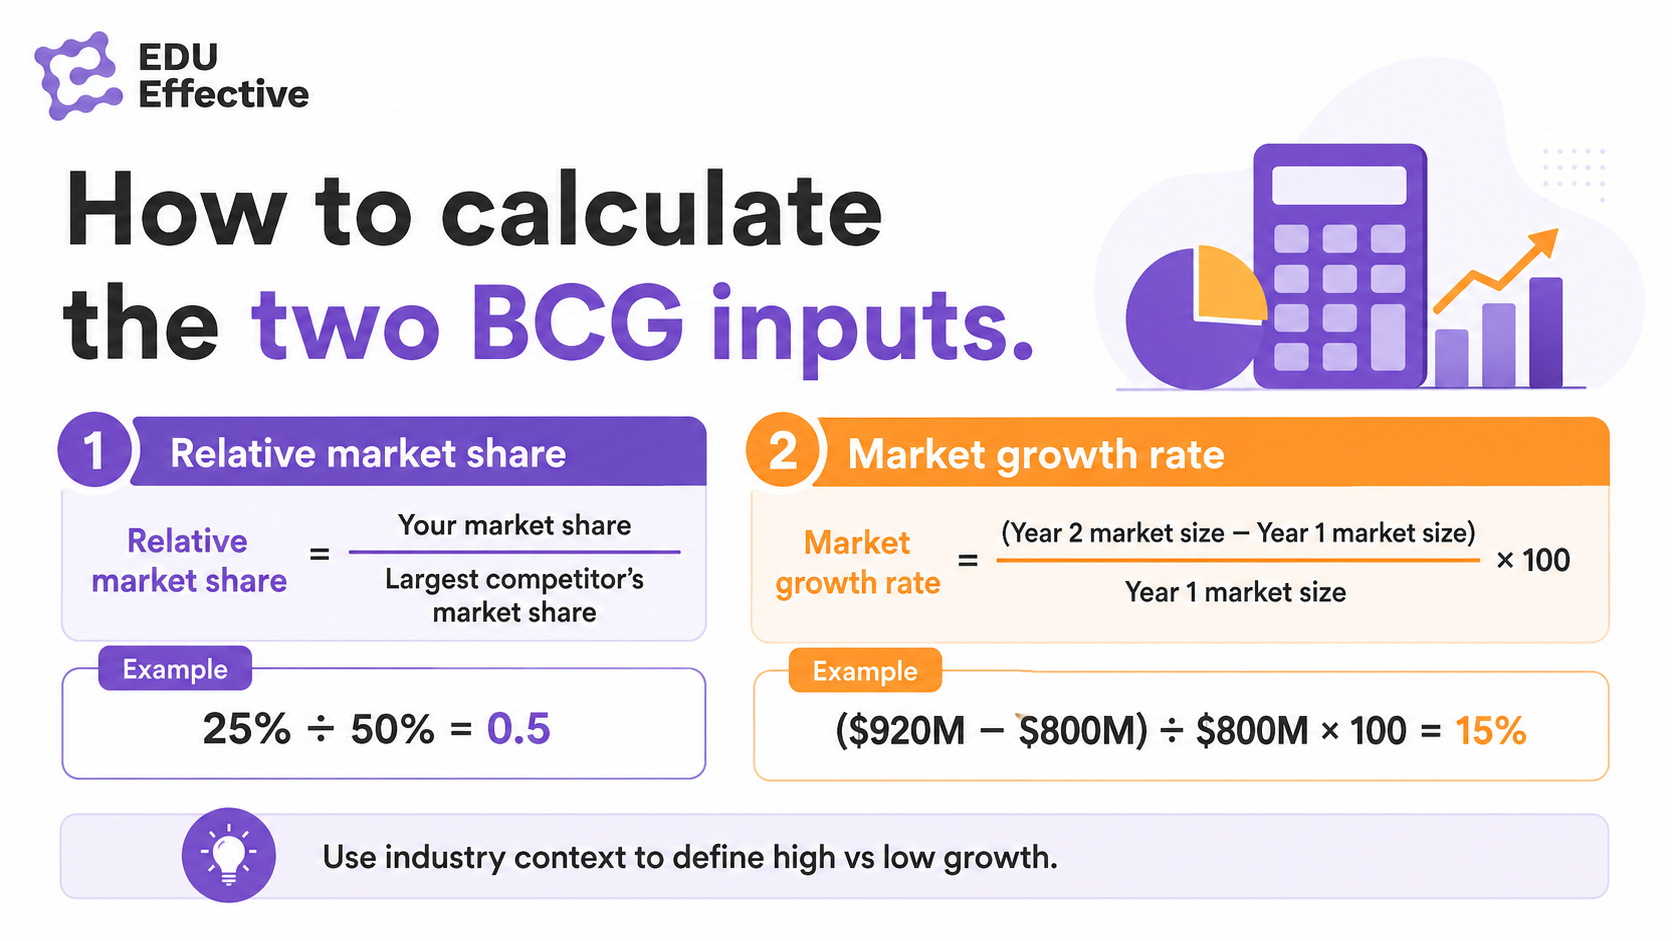
How to calculate the two inputs
Relative Market Share = Your product's market share ÷ Leading competitor's market share
Example: if your product holds 25% of the market and the leader holds 50%, your relative market share is 0.5. A score below 1.0 places you in the right-hand quadrants (question mark or dog depending on market growth).
Market Growth Rate = (Market size Year 2 - Market size Year 1) ÷ Market size Year 1 × 100
Example: if a market grew from $800 million to $920 million, the growth rate is 15%. The threshold between "high" and "low" growth varies by industry — BCG originally used 10% as a dividing line, but in practice the median growth rate for your specific industry or portfolio is a more useful benchmark.
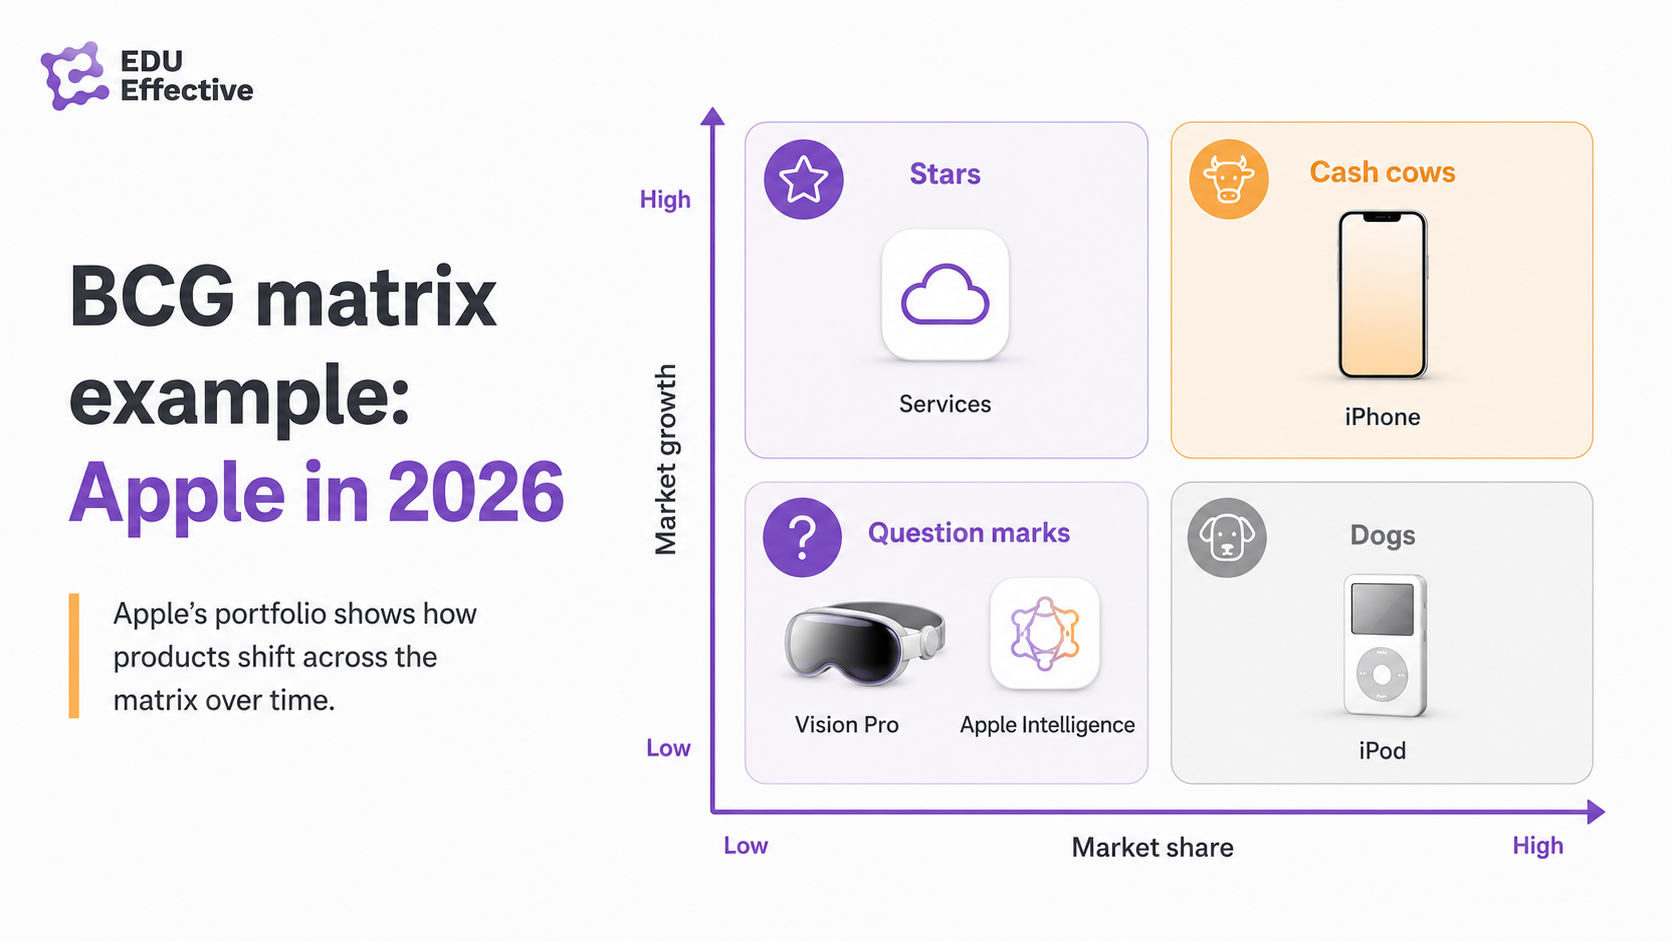
BCG matrix example: Apple in 2026
Apple is the most frequently cited BCG matrix example in business education — which means it's also the most frequently mis-cited. Most analyses still place the iPhone in the Star quadrant. That was accurate a decade ago. It isn't now.
The global smartphone market grew just 1.5% in 2025, according to IDC data. A market growing at 1.5% annually is not a high-growth market by any reasonable definition. And Apple holds dominant relative market share in the premium segment (above $600 ASP). That combination — high share, low growth — places the iPhone squarely in the Cash Cow quadrant. At $209.6 billion in fiscal 2025 revenue, it is the largest single cash cow in corporate history by a significant margin.
The Star in Apple's 2026 portfolio is Services — iCloud, the App Store, Apple Music, Apple TV+, Apple Pay, and related recurring revenue streams. Services grew 13.5% to a record $109.2 billion in fiscal 2025. High growth, high share. The real star of the portfolio.
The Question Marks include Apple Vision Pro — launched in early 2024 at $3,499, with meaningful market creation potential but currently negligible market share in a segment that barely exists yet — and Apple's AI features suite (Apple Intelligence), which is building toward an integration advantage but competing against deeply funded incumbents. Both require significant investment with uncertain outcomes.
The Dog category is most instructive for what it reveals about product lifecycle. The iPod was discontinued in 2022 — a dog that was correctly wound down. The Apple Car project, officially cancelled in 2024 after a decade of development spending, never shipped a product and thus never formally entered any quadrant. It stands as one of the most expensive examples of what happens when strategic discipline breaks down in the question mark stage — continued investment in a project that had not established a viable competitive position, long past the point when the evidence warranted reassessment.
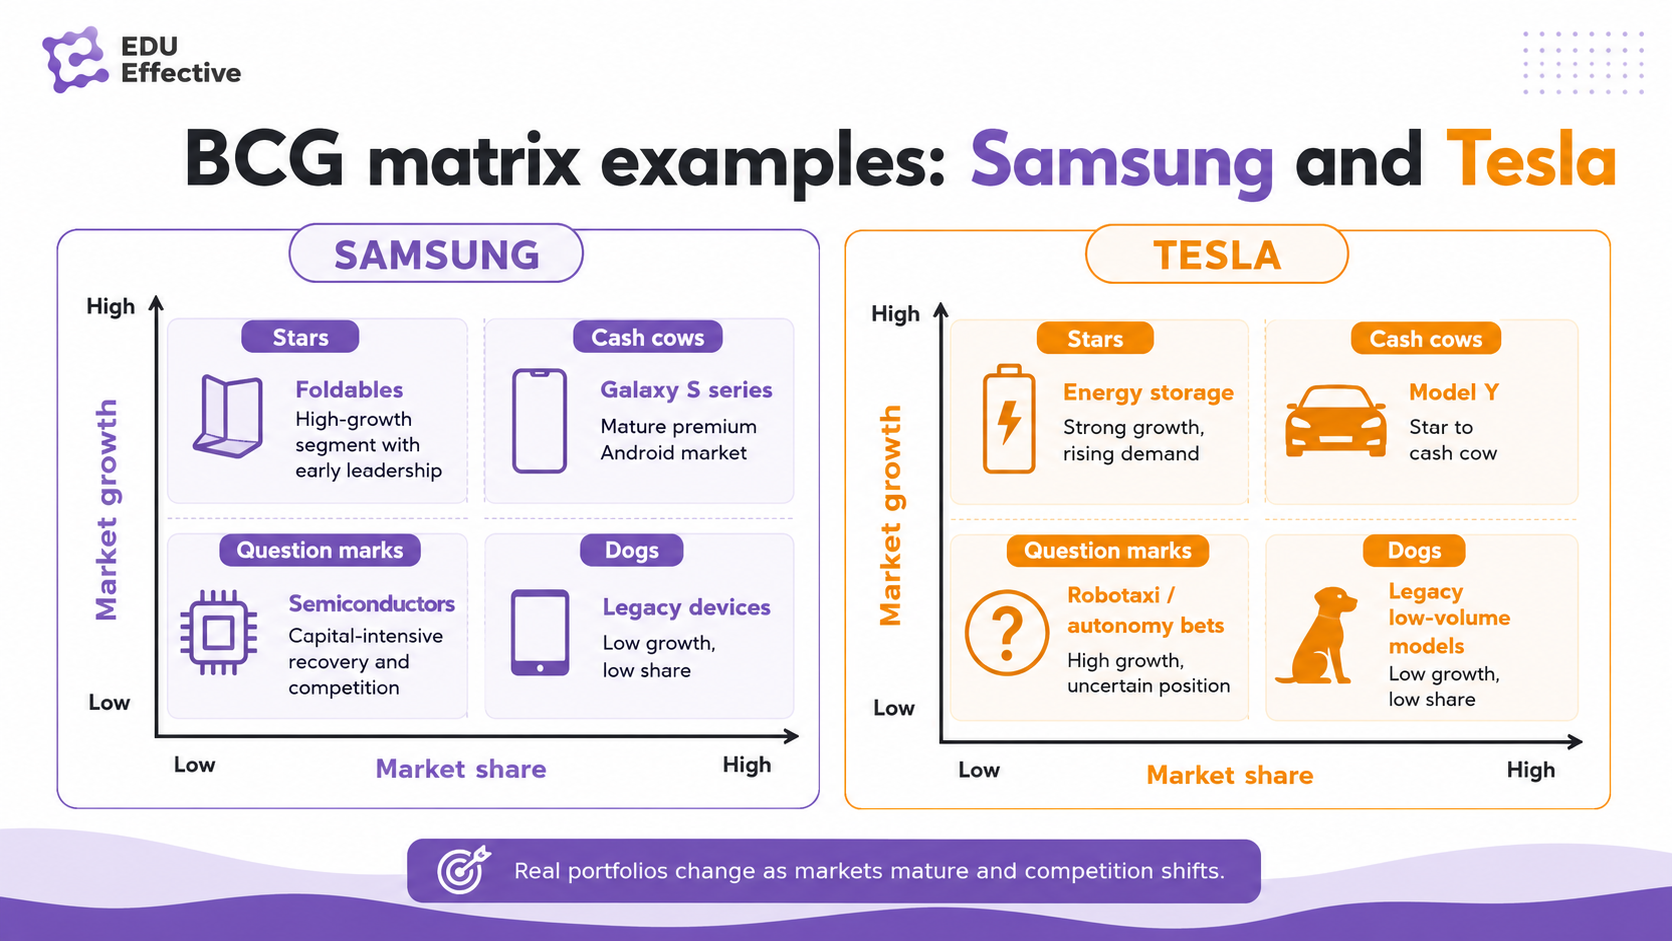
BCG matrix examples: Samsung and Tesla
Samsung illustrates the BCG framework across a hardware-heavy portfolio. The Galaxy S series — premium smartphones — sits in the cash cow quadrant: dominant share in a maturing premium Android market, generating the surplus cash that funds everything else. Foldable devices (Galaxy Z Fold and Flip series) are Stars: high growth in an emerging segment where Samsung holds commanding early share. Samsung's semiconductor division is a complex case — it held cash cow status for years, but aggressive investment by TSMC and a cyclical downturn shifted its competitive position, creating a temporary question mark scenario that Samsung has been working to resolve through capital-intensive investment in advanced process nodes.
Tesla demonstrates the quadrant-shifting dynamics the BCG model predicts. In 2019, Tesla's entire vehicle lineup — Model S, Model 3, Model X, Model Y — sat firmly in the question mark quadrant: significant growth potential, but small share of a total automotive market dominated by incumbents. By 2024, with EVs becoming mainstream and Tesla holding double-digit global EV market share, Model Y moved toward star status. The more recent challenge is that EV market growth has moderated in key markets, and Tesla's market share has come under pressure from BYD and domestic Chinese manufacturers — which means the strategic positioning of its core models requires reassessment. Model Y may be transitioning from star toward cash cow, while Tesla's energy storage division (Megapack) shows the clearest star characteristics in its current portfolio.
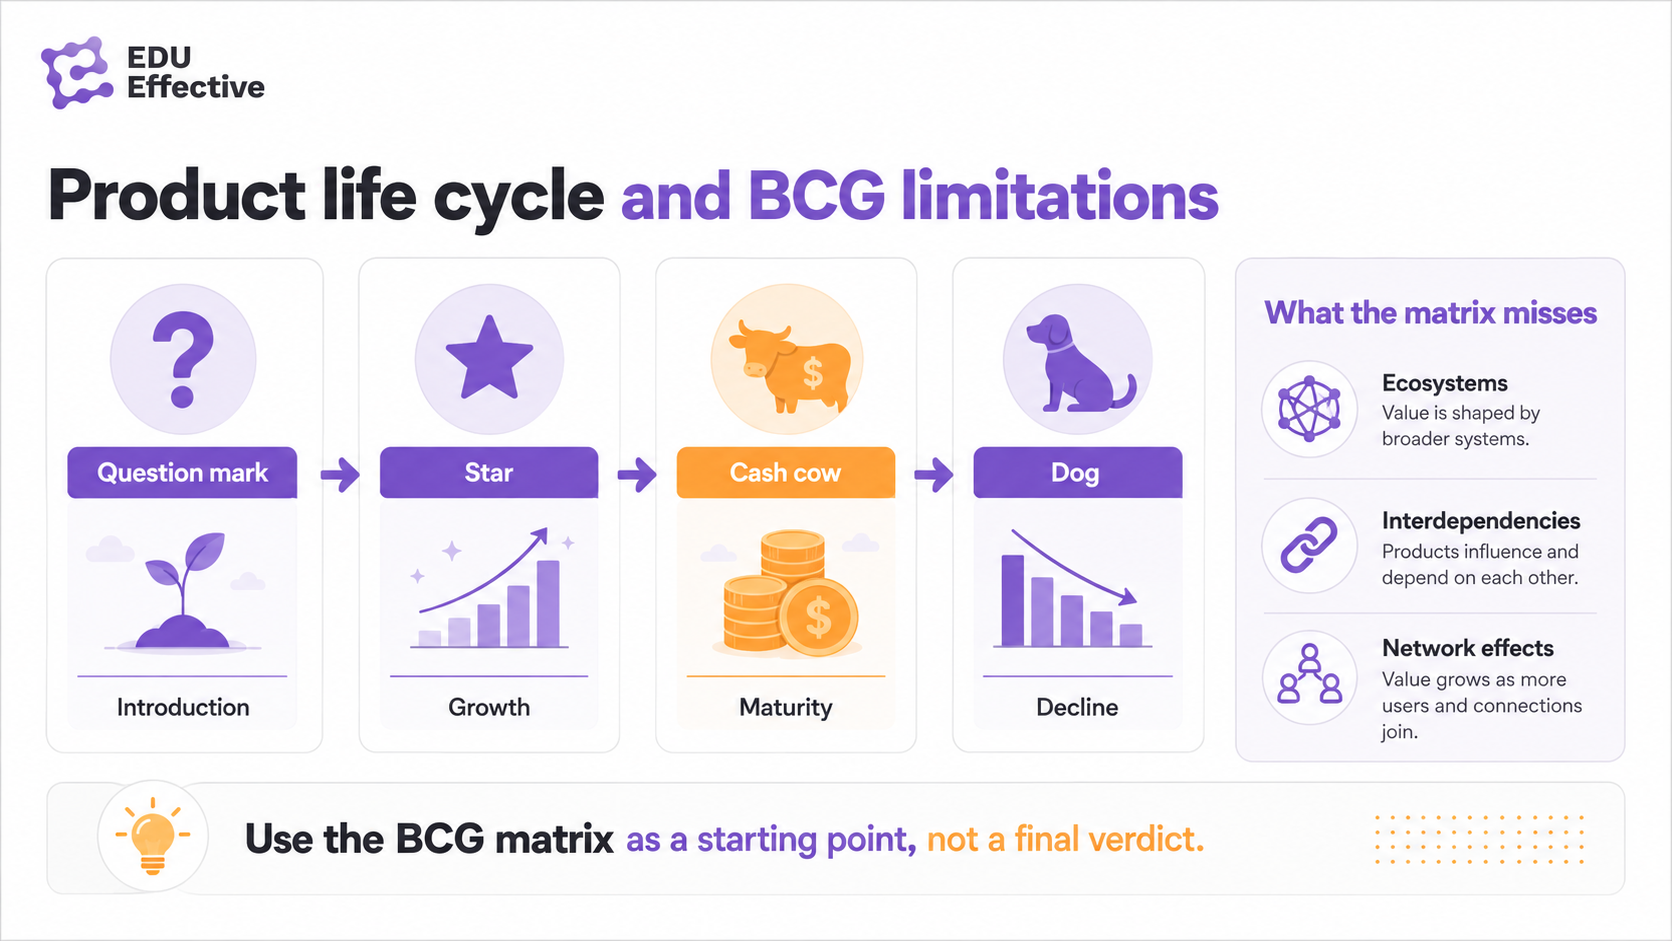
The BCG portfolio matrix and the product life cycle
One of the framework's strongest features is how closely it maps to the product life cycle. Question marks represent products in the introduction phase — newly launched, with high investment requirements and uncertain outcomes. Stars are products in the growth phase — winning in expanding markets. Cash cows are in the maturity phase — established, efficient, generating surplus. Dogs are in the decline phase — losing ground in shrinking markets.
Understanding this mapping makes the strategic implications clearer. A portfolio heavily weighted toward question marks is a portfolio with an uncertain near-term future and high cash requirements. A portfolio weighted toward cash cows is generating strong near-term returns but faces long-term renewal risk if no stars or question marks are being developed. A balanced portfolio — cash cows funding investment in stars and selected question marks — is the BCG model's ideal.
What the BCG analysis misses — and what to do about it
The BCG matrix simplifies complex competitive reality into two variables. That's simultaneously its strength and its limitation.
A dog in one company's portfolio might be a strategic complement to a star — providing the full product line that enables enterprise sales, for instance. A question mark might be strategically vital as a competitive blocker, preventing a rival from establishing a position that would eventually threaten the cash cows. The matrix doesn't capture these interdependencies.
It also underweights brand value, network effects, and ecosystem dynamics that are increasingly central to competitive advantage in 2026. Apple's question marks benefit from the iOS ecosystem in ways that make their competitive position stronger than raw market share suggests. Tesla's energy storage business benefits from the same distribution and brand infrastructure as its vehicles.
The practical recommendation: use the BCG growth-share matrix as a first-pass tool for portfolio conversations, not as a final verdict. It forces the right questions — where are we generating cash, where are we consuming it, and where are we genuinely building the future? Pairing it with deeper competitive analysis for each quadrant produces better strategic decisions than either tool alone.
At EDU Effective, our Effective MBA business programs use live company examples to teach strategic frameworks as working tools — not historical cases. Explore our programs →
EDU Effective Business School = professional development for your long-term success.
All best-selling Effective MBA programs are built for working adults: 15 minutes a day, 10 months or less, ASIC accredited, from €990.
These are professional programs, not academic ones — built for working adults to apply what they learn directly in their own business, not to collect a scholarly credential.
Join more than 9,000 students in over 120 countries who are investing in their professional development and career success.
Read the feedback and experiences of our students and the stories of our graduates here.
Apply now — from €990 · Talk to a Study Advisor
Study with NO risk: 14-day money-back guarantee, no questions asked.
Sources
- Business Model Analyst — Apple BCG Matrix Analysis (2026) businessmodelanalyst.com/apple-bcg-matrix-analysis/
- Alejandro Rioja — From Concept To Action: BCG Matrix With Examples (2026) alejandrorioja.com/bcg-matrix-with-examples/
- Creately — BCG Examples to Unlock Growth Opportunities creately.com/guides/bcg-matrix-examples/
- FasterCapital — Examples of Successful Companies Using the BCG Matrix fastercapital.com/topics/examples-of-successful-companies-using-the-bcg-matrix.html
- Business Model Analyst — BCG Matrix: What is it, Examples, and How to Use It businessmodelanalyst.com/what-is-bcg-matrix/